Plan
A planned value in Ruddr is exactly what it sounds like - it is what you had planned to deliver for a given period of time. Here are some examples of reports that present planned values:- Hours Plan by Project and Resource - shows all of the planned hours (for the reporting period) based on the resource allocations for each project.
- Utilization Plan by Member - shows the planned utilization metrics per workspace member based on the resource allocations and each member’s capacity.
- Performance Plan by Project - shows the comprehensive planned project performance including the hours, revenue, cost, profit, and margin.
Actuals
While a planned value is what was intended, an actual value is what was ultimately delivered. For example, if I worked 30 hours last week on a Time and Materials project at a bill rate of $150 per hour, my actual services revenue generated for the week is $4,500. If I had been allocated to work 40 hours on that project, my 10 hour shortfall would result in a services revenue variance of -$1,500. Ruddr tracks actuals for many metrics including hours, revenue, cost, profit, margin, and utilization.Forecast
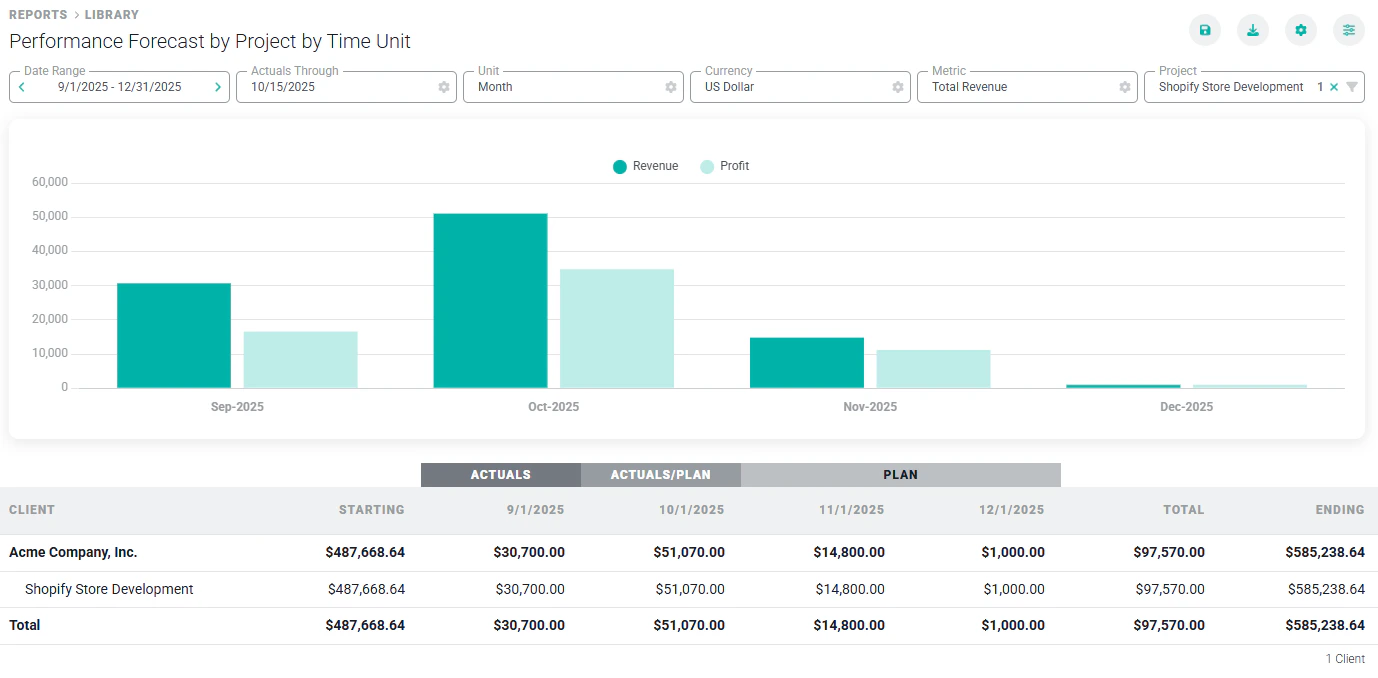
A forecast in Ruddr combines actuals and plan values based on an “Actuals Through” date. For example, let’s say that today is the last day of January and I want to estimate our company’s first quarter services revenue. I can run the “Performance Forecast by Project by Time Unit” for the quarter with the Actuals Through date set to January 31st. Ruddr will combine actual values for January and plan values for February and March into a single, cohesive report. The power of forecasting in Ruddr is rooted in this ability to combine actuals and plan based on a date of your choosing. Extending the example above, let’s assume that it is February 15th and you need an estimate of first quarter services revenue. You know that many of the personnel in your workspace rarely get their time entered until the end of the month. Since time entry is not up to date, using actuals through February 15th would understate both hours and revenue. By setting the Actuals Through date back to the end of January, you get a more realistic forecast because Ruddr uses plan values for all of February and March. The screenshot below shows the “Performance Forecast by Project by Time Unit” report from September 1st through December 31st, with an Actuals Through date of October 15th. Note that in the report data, the month of September has an “Actuals” header, the month of October has an “Actuals/Plan” header, and the months of November and December have a “Plan” header. The data shown for October is combining actual values through October 15th and plan values for remainder of the month.